Telegram RegisterThe public register of Telegram

Channel

Датавиз и JS

@dataviz_js

On this record: Growth · Engagement · What this channel posts · Reactions · Posts · Citations · Cite this entry

39subscribers

+0 since we began measuring on 7 August 2026

Risers and fallers across the register · movement among entries of Under 1,000.

Register entry

Telegram ID-1002468990870
TypeChannel
Username@dataviz_js
DescriptionПроекты связанные с визуализацией данных, на Javascript. @kalipsik
Created26 December 2024measured — dated from the channel’s first post
First recorded10 August 2026
Last confirmed live10 August 2026
Measurements held2
On Telegramt.me/dataviz_js

Growth

397 August 2026 — 39 subscribers10 August 2026 — 39 subscribers7 August 202610 August 2026
2 measurements spanning 3 days. Dots are measurements; the straight line between them is drawn to join them, not to claim we know the path taken in between — snapshots are recorded only when a count changes, so gaps mean “no change observed”, never “interpolated”. The vertical axis spans 38–40 and does not start at zero.
Measurement log — every subscribers count we have recorded
Measured (UTC)SubscribersChange
10 Aug 2026, 19:4639no change
7 Aug 2026, 15:2139first reading

Engagement

10 posts held, back to 26 December 2024the reader has not yet reached the start of this channel’s public history, so older posts may sit further back, unread. Read across 1 pageof Telegram’s post history, 20 posts per page.

Nothing published in the last 30 days. ERR and ER are rolling 30-day measures, so there is nothing to compute — we hold 10 posts for this entry, the most recent from 8 September 2025. An engagement rate over an empty window would be a number about nothing.

What this channel posts

Photos
14
Videos
3
Links
7

Lifetime counters from Telegram’s own channel header, read 10 August 2026 — not the date at the top of this page, which is when the subscriber count was last read. Below Telegram’s rounding threshold, so these counts are exact.

Video runtime
1m 31s
Average length
30s

Measured directly from 3 videos with a duration reading, out of the posts we hold for this channel — not this channel’s whole posting history, only the sample this register has actually read. An exact reading to the second, taken from the post itself rather than from Telegram’s own rounded chrome, so it carries no mark.

Reaction mix

55 reactions across 9 posts, in 4 distinct kinds. The most used accounts for 61.8% of them.

Every reaction kind recorded on the sample, most used first
ReactionCountShareShare, drawn
3461.8%
🥰814.5%
👍712.7%
🔥610.9%

No sentiment is inferred, and none should be read in. This table is ordered by count and by nothing else. Emoji do not carry stable meaning across languages or communities — 🙏 is thanks in one channel and mourning in another — so we publish which ones were pressed and how often, and pass no judgement on what an audience meant by them.

Precision. Telegram publishes reaction counts per emoji and short-forms each one — 4.34K, 1.2M — so any single kind at or above 1,000 reaches us at three significant figures, and only counts below 1,000 are exact. The shares above are ratios of those figures and carry the same error. This is also why the total here can differ slightly from a reaction total printed elsewhere on the page: both are sums of the same rounded parts, taken over samples with different edges.

Coverage. Reactions were read on 9 of the 10 sampled posts in this sample. Summed by Telegram’s own count on each post — not by adding up the per-emoji breakdown above — those same posts carry 55reactions in total: the kind of figure the paragraph above means by “a reaction total printed elsewhere on the page”.

Measured over the 10 most recent posts we hold, published 26 December 2024 to 8 September 2025, using the newest reading held for each. Telegram Stars are excluded: they are a payment, not a reaction, and they have their own section.

Recent posts

8 Sept 2025, 09:01 UTC184 views9 reactionsread 10 August 2026
Photo

Shaded relief или elevation map. В этом проекте я хотела повторить урок для Blender по созданию рельефных карт из высотных карт (приложенная черная картинка). В Blender они смотрятся, конечно, реалистичнее и красивее, но на данных момент я хочу просто зафиксировать результат, к которому пришла за лето. Алгоритм примерно такой: 1. Накладываем высотную карту на плоскость со множеством вершин. 2. Присваиваем каждой

7👍2

19 May 2025, 15:47 UTC232 views1 reactionsread 10 August 2026
Forwarded from @dataart11Photo

Приглашаем разработчиков, аналитиков, дизайнеров, дата-журналистов и исследователей принять участие в хакатоне Data Sense от Сбериндекса, который состоится 7 июня офлайн в Москве! Участников ждут уникальные наборы данных с муниципальной статистикой от Сбериндекса, призовой фонд 450 тысяч рублей и 3 номинации. Поддержка менторов и новые, полезные знакомства. Вы можете взять одну из предложенных задач или придумать св

1

2 May 2025, 12:49 UTC225 views5 reactionsread 10 August 2026
Photo

Лаконичная 3d визуализация на R + Cables.gl от Mohamad Waked на тему "Кто выигрывает войны?" с 1816 по 2007 год. Сама визуализация и почитать о проекте.

5

1 Apr 2025, 11:48 UTC≈2,210 views19 reactionsread 10 August 2026
Video

Проект Data Driven Cats для вдохновляющего сообщества Цветы и цифры. Здесь я отобразила навыки каждого участника сообщества: уровни знаний в данных, датавизе, рисовании и рукоделии. Получились такие иллюстрации. Рисовала их в векторе, а затем с помощью формата SVG и манипуляций над ним в React'е раскрасила котов в разные цвета, соответствующие уровню навыка. Полностью посмотреть можно здесь. По клику на кота можно

12🥰4👍3

12 Mar 2025, 17:14 UTC283 views2 reactionsread 10 August 2026
Video

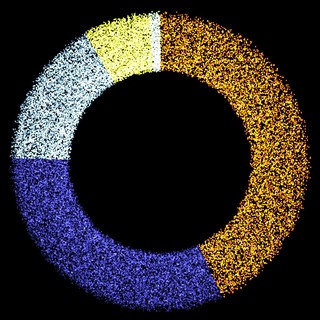
Донат чарт на Three.js. Можно менять количество и размер частиц (сделано на particles), радиусы внутренний и внешней. Скрипту передается массив значений. Высчитываем их процентное соотношение и рисуем такой график ☺️

🔥2

27 Feb 2025, 04:13 UTC244 views5 reactionsread 10 August 2026
Photo

В проект про бердвотчинг перенесла аналог визуализации Jer Thorp. Интересно было попробовать нарисовать график с помощью SVG. Так как это формат векторной графики, читаемый браузером, то теоретически мы можем программно передавать в тег <svg></svg> параметры цвета, прозрачности, масштаба и прочее. В Plotly не получилось, т.к библиотека все-таки больше предназначена для классического датавиза. В Pixi.js были проблем

🔥41

17 Feb 2025, 03:14 UTC232 views6 reactionsread 10 August 2026
Photo

Визуализация для Open Data Armenia Использовала pandas для обработки данных, для интерфейса React + Plotly для графиков + Mapbox для карт. Разработка простая и без изысков, но есть две изюминки =) Первая - это визуализация данных на Mapbox. Создать точки в Mapbox можно двумя способами: Layout и Marker. Первый способ предназначен для больших данных, без интерактива, второй - для небольшого количества данных (до 1000

🥰4👍2

13 Jan 2025, 21:13 UTC704 views4 reactionsread 10 August 2026
Photo

В конце декабря я увидела пост о конкурсе Open Data Armenia про физические визуализации и решила поучаствовать. Я как раз искала идеи для визуализаций несложные и быстрые, чтобы «разрисоваться»: набить руку, научиться видеть художественное в данных. А тут появился стимул сделать законченную работу. Очень часто я начинаю какие-то рисунки, проекты, но в середине пути - они мне перестают нравится, потому что получает

4

Showing the 10 most recent of 10 posts we hold for @dataviz_js. View and reaction counts are the latest single reading for each post, not a live figure, and a recent post is still accumulating both. A view count marked was rounded by Telegram before we ever saw it — t.me prints views in full below 1,000 and to three significant figures above, so ≈1,200,000 means somewhere between 1,150,000 and 1,249,999. Unmarked counts are exact. Text is reproduced from the public post preview and truncated for length.
Forward network

Republishes

Channels on the register whose posts this channel has forwarded.

Built only from forwarded posts we have actually read, on both sides. Coverage is early and deliberately incomplete: a missing link means we have not read the post that would prove it, never that the relationship does not exist. Counts are distinct forwarded posts observed, so they only ever go up as we read more.

Cite this entry

A live page changes as we take new readings, so a citation should name the measurement it is based on, not just the URL. The line below cites the subscriber count as measured 10 August 2026 — this entry's latest reading, not the date you are reading this.

“Датавиз и JS” (@dataviz_js), 39 subscribers as measured 10 August 2026. Telegram Register, tgregister.com/channel/dataviz_js.

Full measurement history, CC BY 4.0. Every reading this register holds for this entry, not just the latest one, as a dated, downloadable record: CSV · JSON. Free to use with attribution to tgregister.com. Each file carries its own generation timestamp, which is the figure to cite for exactly when the data was retrieved.