28 Sept 2026, 12:08 UTC≈9,980 views34 reactionsread 29 September 2026
Photo
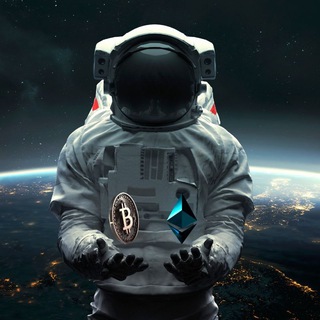
Photo, posted without a caption
❤7🎉3🏆3👍3💯3🔥3😍3🙏3
Channel
@Crypto_wllah
On this record: Topic · Growth · Engagement · What this channel posts · Reactions · Posts · Citations · Cite this entry
28,539subscribers
-1,355 since we began measuring on 10 August 2026
Risers and fallers across the register · movement among entries of 10,000–31,623.
| Telegram ID | -1001981213366 |
|---|---|
| Type | Channel |
| Username | @Crypto_wllah |
| Description | Crypto - media, marketing, design analytics, news. It is a high-quality solution that meets all the needs of customers in work and business. Save time with Crypto! Promotion_ @Premkumarchoudhry Buy ad https://telega.io/c/Crypto_wllah |
| Created | Between 1 April 2023 and 31 October 2023 — estimated from Telegram’s id allocation, not measured. How this range is calculated. |
| First recorded | 10 August 2026 |
| Last confirmed live | 18 September 2026 |
| Measurements held | 29 |
| Confirmed unchanged | 1 time, most recently 18 September 2026 |
| On Telegram | t.me/Crypto_wllah |
Crypto & trading — a classification, not a measurement. An on-box language model (Qwen3.6-35B-A3B-FP8, prompt version 1) read this channel’s own recent posts on 10 September 2026 and assigned it the closest of 31 fixed categories, at 100% confidence. This is a model’s judgement about what the channel is likely to be about, not a fact this register measured the way a subscriber count or a view count is measured — it can be revised on a later pass, and it carries no weight anywhere else on this page. How this classification works, and why it has no browse page of its own yet.
| Measured (UTC) | Subscribers | Change |
|---|---|---|
| 18 Sept 2026, 05:00 | 28,539 | -56 |
| 15 Sept 2026, 22:01 | 28,595 | -21 |
| 14 Sept 2026, 09:17 | 28,616 | -65 |
| 12 Sept 2026, 16:01 | 28,681 | -72 |
| 10 Sept 2026, 16:16 | 28,753 | -99 |
| 7 Sept 2026, 11:20 | 28,852 | -101 |
| 4 Sept 2026, 13:17 | 28,953 | -39 |
| 3 Sept 2026, 01:59 | 28,992 | -46 |
| 1 Sept 2026, 21:53 | 29,038 | -42 |
| 31 Aug 2026, 21:16 | 29,080 | -70 |
| 30 Aug 2026, 18:48 | 29,150 | -45 |
| 29 Aug 2026, 15:49 | 29,195 | -27 |
| 28 Aug 2026, 17:16 | 29,222 | -36 |
| 27 Aug 2026, 18:05 | 29,258 | -23 |
| 26 Aug 2026, 15:54 | 29,281 | -39 |
| 25 Aug 2026, 16:22 | 29,320 | -48 |
| 24 Aug 2026, 16:24 | 29,368 | -70 |
| 23 Aug 2026, 03:15 | 29,438 | -62 |
| 21 Aug 2026, 13:08 | 29,500 | -37 |
| 20 Aug 2026, 11:17 | 29,537 | first reading |
24 posts held, back to 22 January 2026 — the reader has not yet reached the start of this channel’s public history, so older posts may sit further back, unread. Read across 64 pages of Telegram’s post history, 20 posts per page.
ERR is average views per post over the last 30 days divided by subscribers, the definition TGStat uses, so this figure is comparable with the one you will see elsewhere. It falls structurally as a channel grows: a high ERR on a small channel and a low one on a large channel describe reach mathematics, not quality. We publish the figure and the sample it came from and pass no verdict on it.
ER is defined industry-wide as (forwards + reactions + comments) ÷ views — note the denominator is views, not subscribers. Telegram’s public web preview carries views and reactions but not forward or comment counts, so the reaction rate above is the reactions term only and is therefore a floor: the true ER for this channel is higher by an amount we have not measured and will not estimate.
| Window | Rolling 30 days · latest post in window 28 September 2026 |
|---|---|
| Posts held | 24 (22 January 2026 – 28 September 2026) |
| Views total | 29,880 |
| Reactions total | 98 |
| Forwards / comments | not exposed by the public surface — not measured, not estimated |
| Readings taken | 29 Sept 2026, 23:29 UTC |
Views are a single reading per post, taken at the time above. A post published in the last day or two is still accumulating views, which pulls the 30-day average down slightly. That is a property of the standard definition rather than a fault in it, so we keep the definition rather than “correcting” the number into something nobody can reproduce.
Precision. Telegram publishes view counts on its public widget in short form — 8.12K, 3.7M — so any reading at or above 1,000 reaches us rounded to three significant figures, and only counts below 1,000 are exact. Averages and rates derived from them are shown to the same precision rather than to the unit: a figure like 3,701,250 would assert digits nobody measured.
Reaction counts are published per emoji and rounded the same way, so a total below 1,000 is exact and a larger one is a sum that may carry a rounded component from each emoji above 1,000. Because it is a sum, it does not look rounded — read a large reaction total as three significant figures per contributing emoji rather than as the figure it prints.
Lifetime counters from Telegram’s own channel header, read 29 September 2026 — not the date at the top of this page, which is when the subscriber count was last read. Below Telegram’s rounding threshold, so these counts are exact.
654 reactions across 24 posts, in 21 distinct kinds. The most used accounts for 22.9% of them.
| Reaction | Count | Share | Share, drawn |
|---|---|---|---|
| 👍 | 150 | 22.9% | |
| ❤ | 145 | 22.2% | |
| 😍 | 58 | 8.87% | |
| 🔥 | 42 | 6.42% | |
| 🏆 | 40 | 6.12% | |
| 🎉 | 36 | 5.50% | |
| 💯 | 35 | 5.35% | |
| 🙏 | 34 | 5.20% | |
| ⚡ | 29 | 4.43% | |
| 🫡 | 19 | 2.91% | |
| 🤗 | 18 | 2.75% | |
| 🥰 | 15 | 2.29% | |
| 👏 | 10 | 1.53% | |
| 🤣 | 7 | 1.07% | |
| 🤩 | 4 | 0.612% | |
| 👌 | 3 | 0.459% | |
| 😁 | 3 | 0.459% | |
| 🐳 | 2 | 0.306% | |
| 🕊 | 2 | 0.306% | |
| 😎 | 1 | 0.153% | |
| 1 further kind | 1 | 0.153% |
No sentiment is inferred, and none should be read in. This table is ordered by count and by nothing else. Emoji do not carry stable meaning across languages or communities — 🙏 is thanks in one channel and mourning in another — so we publish which ones were pressed and how often, and pass no judgement on what an audience meant by them.
Precision. Telegram publishes reaction counts per emoji and short-forms each one — 4.34K, 1.2M — so any single kind at or above 1,000 reaches us at three significant figures, and only counts below 1,000 are exact. The shares above are ratios of those figures and carry the same error. This is also why the total here can differ slightly from a reaction total printed elsewhere on the page: both are sums of the same rounded parts, taken over samples with different edges.
Coverage. Reactions were read on 24 of the 24 sampled posts in this sample. Summed by Telegram’s own count on each post — not by adding up the per-emoji breakdown above — those same posts carry 654 reactions in total: the kind of figure the paragraph above means by “a reaction total printed elsewhere on the page”.
Measured over the 24 most recent posts we hold, published 22 January 2026 to 28 September 2026, using the newest reading held for each. Telegram Stars are excluded: they are a payment, not a reaction, and they have their own section.
Photo, posted without a caption
❤7🎉3🏆3👍3💯3🔥3😍3🙏3
📱➡️💀 First Day in Crypto vs. 3 Years in Crypto! Day 1: New phone, new dreams, and big expectations. 🚀📈 3 years later: The phone looks like it survived a war! 😂📉 Crypto doesn’t just test your portfolio—it tests your patience. ₿ #Crypto #Bitcoin #BTC #CryptoMeme #CryptoTrader #Trading #HODL #CryptoLife
👍38❤3🎉3🏆3💯3🔥3😍3🙏3
🚨 QUESTION: Does Bitcoin break $80K today, or is the rally running out of steam? Comment why.🤔
👍29❤3🎉3🏆3💯3🔥3🙏3⚡2
Early believers win, the crowd always comes late. 📈🚪 Don't wait for FOMO to hit before you take action. Patience pays off! #XRP #Bitcoin #CryptoInvesting #HODL #CryptoMarket #Ripple
😍28❤3🎉3🏆3👍3💯3🔥3🙏3
📊 Crypto Market Enters August With Cautious Optimism The cryptocurrency market has entered August with investors balancing long-term optimism against short-term economic uncertainty. Bitcoin, stablecoin liquidity, institutional activity, and regulatory developments are expected to remain major themes. Analysts say volatility may continue as traders respond to changing market conditions. #CryptoNews #Bitcoin #Crypt…
❤13🎉3🏆3👍3💯3🔥3😍3🙏3
📊🇺🇸USA vs South Korea 🇰🇷 💰 America's tech giants continue to dominate the global market, with NVIDIA leading at $5.07T in market cap. 🚀 🌍Who will lead the next decade?📈 #MarketCap 💹 #Stocks 📊 #AI 🤖
👍14❤3🎉3🏆3💯3🔥3😍3🙏3
🚨 MARKET UPDATE 📉👀 History doesn't repeat exactly... but it often rhymes. 📊 2022 ➡️ Local bottom ➡️ +42% relief rally 2026 ➡️ Another local bottom forming... Is history about to repeat? 🤔⚡️ 👀 Eyes on Bitcoin. The next move could be explosive! 💸🔥📈
👍29⚡3🏆3💯3🔥3😍3🙏3❤2
🚨 The Dollar Lost Its Power… But Bitcoin Keeps Rising 🚀₿ 💵 Fiat currencies can lose purchasing power over time 📉 ⚡ Bitcoin represents scarcity, decentralization & financial freedom 🌍 🔥 Hold assets that can’t be printed endlessly. ₿ Buy your freedom. Build your future. 🚀✨ #Bitcoin #Crypto #FinancialFreedom #HODL 💎
❤14🎉3🏆3👍3💯3🔥3😍3🙏3
🚨 BREAKING: Same Bitcoin. Same Price. Different Emotions. 🥇🎭 📈 $66K in 2024: 🟢 Extreme Greed (82) 📉 $66K in 2026: 🔴 Extreme Fear (12) 💡 The price didn't change. The sentiment did. 🩵 Fear creates opportunities. 🚀 #Bitcoin #BTC
❤13🔥3⚡2🎉2🏆2👍2💯2😍2
₿ When measured in Bitcoin, everything gets cheaper over time. 🚀 📱🍔🏎️🏠 The real question: Are you stacking sats today? #Bitcoin #BTC #Crypto #DigitalGold #StackSats 🔥
❤13🏆3⚡2🎉2👍2💯2🔥2😍2
🚨💰 JUST IN: Billionaire Mark Cuban reveals he sold “most” of his #Bitcoin holdings 👀💸 📉 “Bitcoin has lost the plot,” he says — sparking fresh debate across the crypto market 🌍⚡️ 🐋 Is this smart profit-taking or a massive mistake before the next bull run? 🚀🔥
❤14⚡2🎉2🏆2👍2💯2🔥2😍2
💰🌍 8 Billion People… But Only 21 Million #Bitcoin 😳🔥 Scarcity Creates Value 📈⚡️ That’s Why Bitcoin Is Digital Gold 🏆₿ 🚀 The Future Belongs To Those Who Understand It Early 💎 HODL Strong • Stay Patient • Stay Bullish 🐂😡
👍13❤3⚡2🎉2🏆2💯2🔥2😍2
Showing the 12 most recent of 24 posts we hold for @Crypto_wllah. View and reaction counts are the latest single reading for each post, not a live figure, and a recent post is still accumulating both. A view count marked ≈ was rounded by Telegram before we ever saw it — t.me prints views in full below 1,000 and to three significant figures above, so ≈1,200,000 means somewhere between 1,150,000 and 1,249,999. Unmarked counts are exact. Text is reproduced from the public post preview and truncated for length.
Republished by
Channels on the register that have forwarded this channel's posts into their own feed.
Built only from forwarded posts we have actually read, on both sides. Coverage is early and deliberately incomplete: a missing link means we have not read the post that would prove it, never that the relationship does not exist. Counts are distinct forwarded posts observed, so they only ever go up as we read more.
A live page changes as we take new readings, so a citation should name the measurement it is based on, not just the URL. The line below cites the subscriber count as measured 18 September 2026 — this entry's latest reading, not the date you are reading this.
“Crypto_wllah” (@Crypto_wllah), 28,539 subscribers as measured 18 September 2026. Telegram Register, tgregister.com/channel/Crypto_wllah.
Full measurement history, CC BY 4.0. Every reading this register holds for this entry, not just the latest one, as a dated, downloadable record: CSV · JSON. Free to use with attribution to tgregister.com. Each file carries its own generation timestamp, which is the figure to cite for exactly when the data was retrieved.